Rain, Rain, Don't Go Away
Maybe it's my obsession with pretty graphs and nice data, but I've always wanted to know one simple piece of information: how much as it rained over the past x days? If x happens to be exactly 30 or however many days it's been since the start of the "rainy season", that's not particularly hard to get (though it requires a surprising amount of googling sometimes). But if you just want to know how much rain fell during the most recent storm, you're pretty much out of luck.
I'm continuing the tradition in my family of having a rain gauge and making little graphs of rainfall each month, but I decided to go all high-tech on the idea and make a website to make these graphs automatically. Also that way I don't have to go out in the rain to read the gauge.
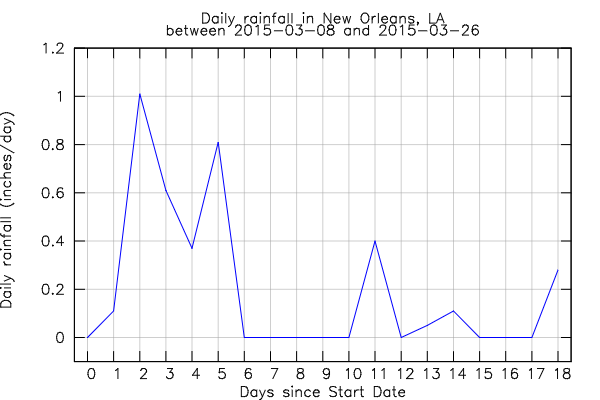
So, yeah, I made a thing: http://rainfallgraphs.com. Check it out! It'll make graphs between any two dates (that it has data for, of course) in various ways! And you can share the graph by copying the URL once it's generated. Here's an idea of what it looks like:
Enter Gnuplot
Hey, Gnuplot can produce an HTML5 canvas element! How about I dynamically generate a webpage server-side by shoving the output of Gnuplot into an HTML file and serving that up like a nice hot dinner? Hey, sounds great!
The basic idea: have some kind of database where I can lookup how much it rained on a specific day, and then use some kind of crappy scripting language to start a gnuplot process and write a bunch of commands to its input in order to generate the desired graph. Which is nice, because I don't need to store any graphs, they're all generated dynamically. And is especially cool because that means I can generate any database query I want to generate any graph I want. Finally, my days of googling for a specific rain data graph are over.
The Database
Erm, what's this database and where does it come from and how is it genera-. Okay, so that part was something I thought was going to be really hard, but was in fact really easy. There's a super handy program in the Arch AUR called weatherman which, in its report, actually returns how much rain has fallen so far today since midnight. All I had to do was set up a cronjob to run the command, get the number, and toss it into a mysql database. There were a couple minor edge cases to worry about (sometimes the program returns zero, so it just uses the number from the previous hour if that happens), but for the most part, it was simple. Most of the PHP code is just determining reasonable values to set for graph parameters to send to Gnuplot.
What can it do?
So for now, it can produce graphs of rain data between two arbitrary dates for select locations, provide that data in line or bar graph form, present it as intensity or totals, and show the data as daily or hourly. It passes parameters in the URL so the graphs are shareable. There are still some things to work out, like in this graph (yeah, that x-axis labeling is weird, don't ask).
California
California is in the middle of a very bad drought. I live in California, so I tend to care about this.
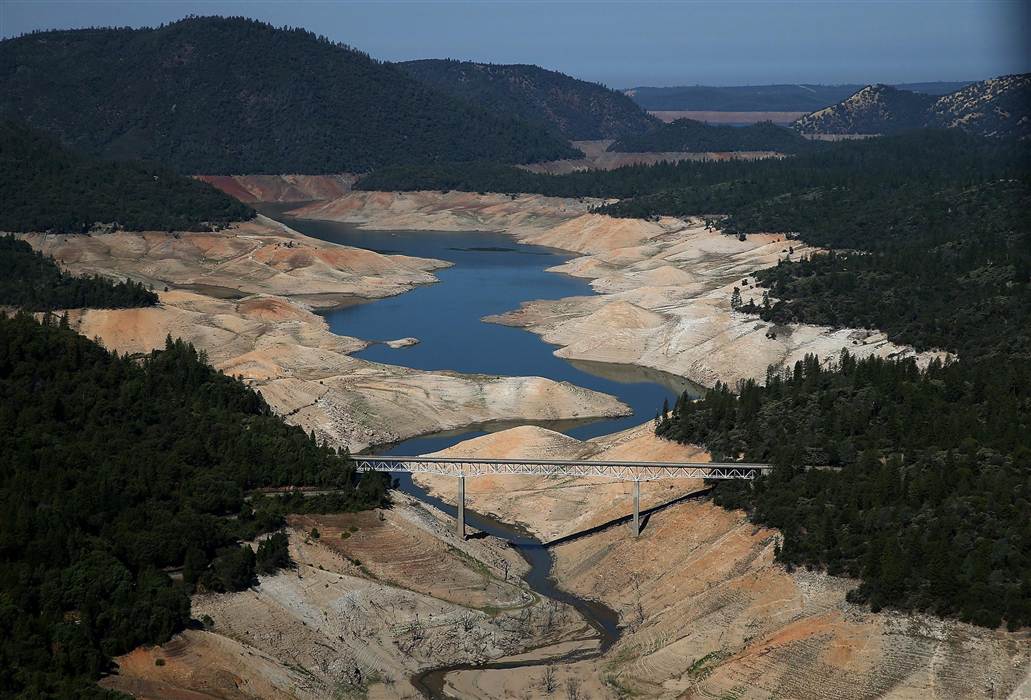
Part of rainfallgraphs.com is an attempt to record just how screwed we are as a state in terms of water. Of course, there are other (more official) agencies (with more money) do the same data recording, but whatever. It's fun to take the data myself.
I'm currently taking data for Santa Cruz (because I live there), Oakland (because my parents live there and my dad is who inspired me to make rain graphs, because he does it too), and New Orleans. Why New Orleans? Because it rains a lot there, and I needed to test my website (since California cities obviously aren't conducive to that). I'd be interested in taking data in more locations, I just don't yet have reason to.
I've only been collecting data since late December of 2014, but there's at least enough there to make some fun graphs. And I can now answer the question of "how much has it rained in the past three days?". Hopefully I'll be able to keep collecting data over the next few years, and then I'll have a lot to play with (and hopefully that data will say that California has been getting more rain).